Customer Effort Score vs NPS vs CSAT Comparison

Understanding Customer Effort Score (CES), NPS, and CSAT is vital for enhancing customer experience. High effort in customer interactions often drives customers to competitors, making CES a key metric for reducing friction. NPS, with response rates between 10–30%, reveals customer loyalty and potential for organic growth. CSAT evaluates satisfaction at specific touchpoints, offering actionable insights. Each metric highlights strengths and weaknesses, helping you create better strategies.

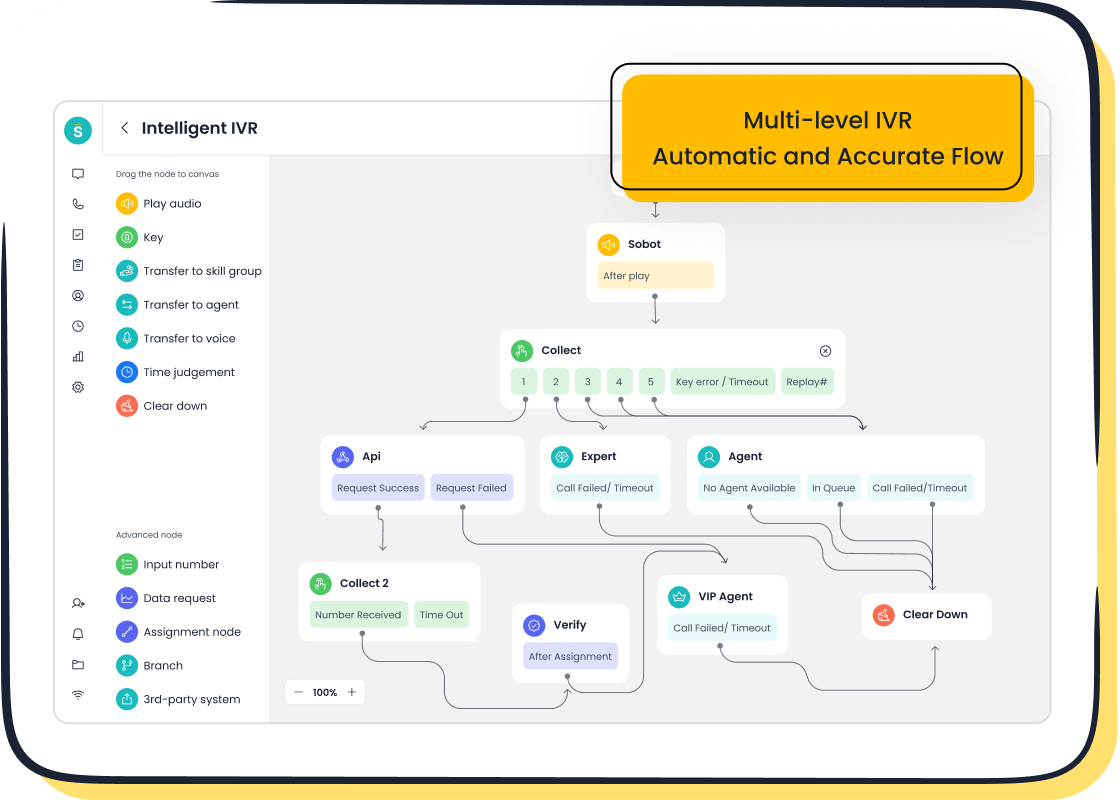
Sobot’s Voice/Call Center empowers businesses to act on these insights. Features like AI-powered voicebots and smart call routing simplify customer interactions, aligning with CES principles. Real-time monitoring ensures quick responses, fostering trust and satisfaction.
What Are CES, NPS, and CSAT?
Customer Effort Score (CES)
Definition and purpose of CES
Customer Effort Score (CES) measures how easy it is for customers to interact with your business. It focuses on the effort required to resolve issues, make purchases, or get support. A lower effort score often correlates with higher customer satisfaction and loyalty. CES is one of the most predictive customer experience metrics for future behavior, helping you identify friction points in your processes.
CES score calculation and methodology
The CES score calculation involves asking customers to rate their experience on a scale, typically from 1 (very difficult) to 7 (very easy). You calculate the CES by dividing the total sum of ratings by the number of responses. For example, if 100 customers provide a total score of 600, the CES would be 6.0. This simple methodology makes it easy to track and act on customer feedback.
Common use cases for CES in customer service
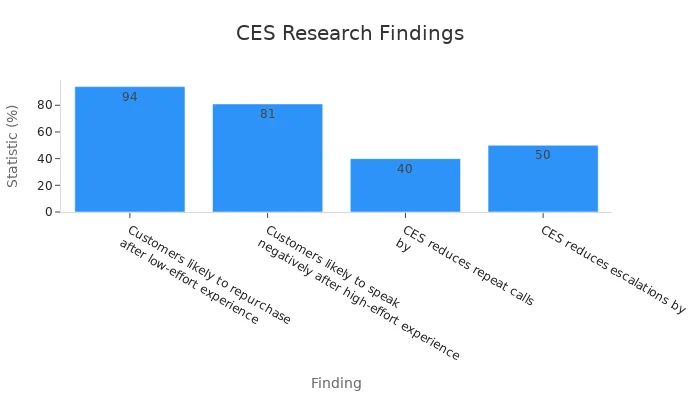
CES is ideal for evaluating specific interactions, such as resolving a technical issue or completing a transaction. For instance, businesses using Sobot’s Voice/Call Center can leverage CES to measure how effectively smart call routing or AI-powered voicebots reduce customer effort. Research shows that 94% of customers are likely to repurchase after a low-effort experience, making CES a valuable tool for improving retention.
Net Promoter Score (NPS)
Definition and purpose of NPS
NPS evaluates customer loyalty by measuring the likelihood of customers recommending your business to others. It provides insights into long-term loyalty and brand advocacy. NPS is widely used across industries due to its simplicity and effectiveness in predicting growth.
How NPS is calculated and interpreted
NPS is calculated by subtracting the percentage of detractors (customers rating 0–6) from the percentage of promoters (customers rating 9–10). Scores range from -100 to +100. A positive score indicates more promoters than detractors, signaling strong customer loyalty. For example, a score of +50 is considered excellent.
Common use cases for NPS in customer loyalty

NPS is best suited for tracking overall brand perception and loyalty over time. It helps you benchmark performance against competitors and assess the impact of customer experience initiatives. For example, Sobot’s solutions, like its unified workspace, can enhance customer interactions, potentially boosting NPS scores.
Customer Satisfaction (CSAT)
Definition and purpose of CSAT
CSAT measures customer satisfaction with a specific interaction or touchpoint. It provides actionable insights into how well your business meets customer expectations during individual experiences.
How CSAT is calculated and applied
CSAT is calculated by dividing the number of positive ratings by the total number of responses and multiplying by 100. For instance, if 80 out of 100 customers rate their experience positively, the CSAT score would be 80%. This metric is often applied through post-interaction surveys.
Common use cases for CSAT in customer interactions
CSAT is ideal for evaluating specific touchpoints, such as a product purchase or a support call. Businesses can use it to identify areas for improvement. For example, companies using Sobot’s AI-powered tools can gather CSAT data to refine their customer service strategies and enhance satisfaction.
| Metric | Focus | Calculation |
|---|---|---|
| NPS | Measures customer loyalty and advocacy | Total Percentage of Promoters - Total Percentage of Detractors |
| CSAT | Assesses customer satisfaction | Number of Positive Ratings / Total Number of Responses x 100 |
| CES | Evaluates customer effort in interactions | Total Sum of Ratings / Total Number of Responses |
Comparing CES, NPS, and CSAT
Purpose and Focus
What each metric measures and its unique focus
Each customer experience metric serves a distinct purpose. Customer Effort Score (CES) evaluates how much effort customers exert to resolve issues, focusing on reducing friction in interactions. Net Promoter Score (NPS) measures loyalty by asking how likely customers are to recommend your brand, offering insights into long-term relationships. Customer Satisfaction (CSAT) assesses satisfaction with specific interactions, such as a support call or product purchase, making it ideal for short-term feedback.
| Metric | Purpose | Focus Area |
|---|---|---|
| CSAT | Measures satisfaction with specific interactions | Short-term satisfaction |
| NPS | Gauges overall brand loyalty | Long-term loyalty |
| CES | Assesses effort required to resolve issues | Customer effort in interactions |
When to use each metric based on business objectives
You should choose a metric based on your goals. Use CES to identify and eliminate pain points in customer interactions. NPS works best for tracking brand loyalty and predicting growth. CSAT is ideal for evaluating specific touchpoints to improve immediate customer satisfaction. For example, Sobot’s Voice/Call Center can help you measure CES by analyzing how smart call routing reduces effort, while its unified workspace can enhance NPS by improving overall customer interactions.
Calculation and Methodology
Differences in survey design and scoring
Survey design varies across these metrics. CES uses a 7-point scale to measure ease of interaction, while NPS employs a 0–10 scale to gauge loyalty. CSAT typically uses a 5-point scale to assess satisfaction. Each metric has a unique calculation method:
| Customer Satisfaction Score (CSAT) | Customer Effort Score (CES) | Net Promoter Score (NPS®) | |
|---|---|---|---|
| Question | How would you rate your experience with your … (e.g. recent support requirement)? | The organization made it easy for me to handle my issue | On a scale of 0-10 how likely would it be for you to recommend [company name] to a friend or colleague? |
| Scale | Very unsatisfied / unsatisfied / Neutral / Satisfied / Very satisfied | Strongly disagree/ Disagree/ Somewhat disagree/ Neutral/ Somewhat agree/ Agree/ Strongly agree | Scale from 0-10 |
| Method of measurement | CSAT score is the sum of respondents that answered somewhat or very satisfied. | After aggregating the replies, a high average indicates that your company is making things easy for your customers. | The Net Promoter Score = % of promoters (respondents that gave a 9-10) – % of detractors (respondents that gave a 0-6) |
Ease of implementation for each metric
CSAT is the easiest to implement due to its straightforward survey design. CES requires a bit more effort to identify specific interaction points. NPS, while simple to calculate, demands a broader approach to gather meaningful insights. Sobot’s tools simplify this process by integrating surveys into customer interactions, ensuring seamless data collection and analysis.
Use Cases and Applications
Best scenarios for CES in reducing customer effort
CES is perfect for identifying friction in processes like resolving technical issues or completing transactions. For instance, Sobot’s AI-powered voicebots and smart call routing can streamline interactions, reducing effort and improving retention.
Best scenarios for NPS in tracking brand loyalty
NPS shines when you want to measure overall brand perception. It helps you understand how likely customers are to recommend your business. Sobot’s unified workspace enhances customer interactions, potentially boosting your NPS.
Best scenarios for CSAT in evaluating specific touchpoints
CSAT works well for assessing satisfaction at individual touchpoints, such as a product purchase or a support call. Sobot’s tools, like its Voice/Call Center, can gather CSAT data to refine strategies and improve customer satisfaction.
Did you know? 49% of NPS users also measure an additional metric, and over 33% of companies use CSAT alongside NPS. This combination provides a more comprehensive view of customer experience.
Benefits and Limitations of Each Metric
Customer Effort Score (CES)
Benefits of CES for actionable insights
Customer Effort Score (CES) provides clear and actionable insights into how much effort customers exert during interactions. It strongly predicts customer behavior and satisfaction. For example, 94% of customers with low effort levels show a high repurchase intention, while only 4% of high-effort customers do the same. CES also identifies weaknesses at specific touchpoints, enabling you to make quick corrective actions. Businesses using tools like Sobot’s Voice/Call Center can leverage CES to streamline processes, such as reducing call handling times through smart routing.
| Customer Effort Level | Repurchase Intention |
|---|---|
| Low Effort | 94% |
| High Effort | 4% |
Limitations of CES in broader customer experience contexts
While CES excels at pinpointing friction in specific interactions, it has a limited scope. It does not provide a comprehensive view of the overall customer experience. For instance, CES identifies issues in customer support but does not reveal the root causes. Additionally, results are not segmented by customer type, which can limit the depth of insights.
| Advantages of CES | Disadvantages of CES |
|---|---|
| Strongly predicts customer behavior and satisfaction | Does not provide a clear picture of overall customer relationship |
| Highly actionable for quick corrective actions | Lacks detailed insights into customer problems |
| Identifies weaknesses at each customer touchpoint | Results are not segmented by customer type |
Net Promoter Score (NPS)
Benefits of NPS for long-term loyalty insights
NPS is a powerful tool for gauging customer loyalty and advocacy. It helps you understand how likely customers are to recommend your brand, offering insights into long-term relationships. Studies like those by Keiningham et al. (2007) highlight its reliability in predicting short-term sales growth. For example, Sobot’s unified workspace enhances customer interactions, which can positively impact your NPS by fostering loyalty.
Limitations of NPS in providing actionable details
Despite its strengths, NPS has limitations. It may not always predict long-term loyalty effectively. Research by Morgan and Rego (2006) suggests that NPS is better suited for short-term sales growth rather than enduring customer loyalty. Additionally, it lacks actionable details, making it harder to identify specific areas for improvement.
Customer Satisfaction (CSAT)
Benefits of CSAT for flexibility in specific interactions
CSAT offers flexibility, allowing you to customize surveys for in-depth analysis. It measures satisfaction at specific touchpoints, such as a product purchase or a support call. For instance, Sobot’s Voice/Call Center can collect CSAT data to refine strategies and improve customer satisfaction. This metric appeals to diverse audiences by using various indicators and survey formats.
| Strengths of CSAT | Limitations of CSAT |
|---|---|
| Flexible metric that can be customized for in-depth analysis | Definition of 'satisfied' varies significantly among customers |
| Can use various indicators to appeal to different audiences | Measures only short-term sentiment based on recent interactions |
| Allows for different survey formats to engage customers | May not provide a complete picture of overall customer satisfaction |
Limitations of CSAT in predicting customer behavior
CSAT primarily reflects short-term sentiment, which may not correlate with long-term loyalty. For example, a customer might feel satisfied with a product but dissatisfied with a specific interaction, complicating the interpretation of CSAT scores. Additionally, the definition of "satisfied" varies among customers, making it challenging to standardize results.
When and How to Use CES, NPS, and CSAT
Choosing the Right Metric for Your Goals
Aligning metrics with business objectives (e.g., retention, satisfaction)
Selecting the right customer experience metrics depends on your business goals. If your focus is on retention, customer effort score evaluation helps identify friction points that drive customers away. Research shows that reducing customer effort fosters loyalty more effectively than delighting customers. For satisfaction, CSAT provides immediate feedback on specific interactions, such as a support call or product purchase. NPS, on the other hand, offers insights into long-term loyalty and advocacy, making it ideal for tracking brand perception.
Aligning these metrics with your objectives ensures a cohesive strategy. For example, Sobot’s Voice/Call Center simplifies customer interactions with features like smart call routing and AI-powered voicebots. These tools reduce effort, improve satisfaction, and enhance loyalty, aligning perfectly with CES, CSAT, and NPS goals.
Industry-specific considerations for metric selection
Different industries benefit from specific metrics. Retail businesses often rely on CSAT to measure satisfaction at key touchpoints like checkout or delivery. Financial services may prioritize NPS to gauge trust and loyalty. Gaming companies might use CES to evaluate how easily players resolve technical issues. Understanding your industry’s unique needs helps you choose the most impactful metric.
Combining Metrics for a Holistic View
How CES, NPS, and CSAT complement each other
Using multiple metrics together provides a comprehensive view of customer experience. CES identifies pain points in interactions, CSAT measures satisfaction at specific touchpoints, and NPS captures overall loyalty trends. Together, they offer actionable insights. For instance, if NPS scores drop, CSAT can pinpoint which interactions caused dissatisfaction. This layered approach ensures you address both immediate and long-term concerns.
Examples of using multiple metrics together with Sobot's Voice/Call Center
Sobot’s Voice/Call Center integrates seamlessly with CES, NPS, and CSAT. For example:
- CES evaluates how smart call routing reduces effort during support calls.
- CSAT measures satisfaction with specific interactions, such as resolving a billing issue.
- NPS tracks overall loyalty by analyzing customer sentiment after multiple interactions.
This integration allows you to monitor and improve every aspect of the customer journey.
Practical Tips for Implementation
Designing effective surveys for CES, NPS, and CSAT
Effective surveys are simple and targeted. Use clear questions and consistent scales to avoid confusion. For example:
- Keep questions concise to improve response rates.
- Use a 1-10 scale for CSAT, as it captures nuances better than a 1-5 scale.
- Include an “N/A” option to prevent forced answers.
Timing is crucial. Send surveys immediately after key interactions to capture accurate feedback. Sobot’s tools can automate this process, ensuring seamless data collection.
Analyzing and acting on results using Sobot's solutions
Analyzing survey results is essential for improvement. Focus on detractors in NPS to understand dissatisfaction. Use CES data to identify high-effort interactions and streamline them. CSAT feedback highlights specific areas needing attention. Sobot’s Voice/Call Center provides real-time analytics, helping you act on insights quickly. For example, its monitoring tools can identify trends, enabling you to adjust strategies and enhance customer satisfaction.
Key Takeaways from CES, NPS, and CSAT Comparison
Summary of Differences
Recap of what each metric measures
Each metric focuses on a unique aspect of the customer experience. Customer Satisfaction (CSAT) measures how satisfied customers feel about specific interactions, such as a product purchase or a support call. Customer Effort Score (CES) evaluates the effort customers exert to resolve issues or complete tasks, highlighting ease of interaction. Net Promoter Score (NPS) gauges customer loyalty by assessing how likely customers are to recommend your business to others.
| Metric | Description |
|---|---|
| Customer Satisfaction (CSAT) | Tracks satisfaction with specific parts of the experience, such as a service or product. |
| Customer Effort Score (CES) | Measures the effort required to resolve issues, focusing on ease of interaction. |
| Net Promoter Score (NPS) | Evaluates the likelihood of customers recommending your business, reflecting overall loyalty. |
Recap of when to use each metric
You should use CSAT to evaluate satisfaction at specific touchpoints, such as after a support call. CES works best for identifying friction in processes, like resolving technical issues. NPS is ideal for tracking long-term loyalty and brand advocacy. For example, Sobot’s Voice/Call Center can help you measure CES by analyzing how smart call routing reduces effort, while its unified workspace can enhance NPS by improving overall customer interactions.
| Metric | Description | Scale | Calculation Method |
|---|---|---|---|
| CSAT | Measures customer satisfaction with a product or service. | 1-10 scale | Average of scores from respondents. |
| CES | Assesses the effort required by customers to use a product. | Graded terms | Average of effort scores from respondents. |
| NPS | Evaluates the likelihood of customers recommending a company. | 0-10 scale | % of promoters - % of detractors. |
Actionable Advice
How to start using these metrics in your business
To begin, research industry benchmarks to understand average performance levels. Analyze competitors to identify areas where you can excel. Set ambitious yet achievable goals for each metric. For example, aim for a CES score that reflects minimal customer effort or an NPS score that indicates strong loyalty. Use tools like Sobot’s Voice/Call Center to automate data collection and streamline survey distribution.
- Research industry benchmarks through market studies.
- Analyze competitors’ performance to set realistic goals.
- Set ambitious yet attainable benchmarks for improvement.
- Continuously monitor and update benchmarks to stay competitive.
Tips for ongoing evaluation and improvement with Sobot's tools
Regularly review your metrics to identify trends and areas for improvement. Use CES data to streamline high-effort interactions. Analyze NPS scores to understand loyalty shifts and address detractor feedback. Leverage CSAT to refine specific touchpoints. Sobot’s Voice/Call Center simplifies this process with real-time analytics and AI-powered tools, helping you act on insights quickly. For example, its smart call routing can reduce effort, while its unified workspace enhances satisfaction and loyalty.
Tip: Combine CES, NPS, and CSAT for a holistic view of your customer experience. This approach ensures you address both immediate concerns and long-term goals effectively.
Understanding CES, NPS, and CSAT is essential for improving customer experience. Each metric offers unique insights, helping you identify pain points, measure satisfaction, and track loyalty. Combining these metrics provides a holistic view, enabling you to enhance retention and drive growth. For instance, good customer experience can increase revenue by up to 84%, while 59% of U.S. customers leave brands after repeated bad experiences.
The best metric depends on your goals. Whether you aim to reduce effort, boost satisfaction, or foster loyalty, aligning metrics with objectives is key. Experiment with these tools to uncover actionable insights. Sobot’s Voice/Call Center simplifies this process with features like smart call routing and real-time analytics, ensuring you can act on feedback effectively.
Tip: Integrating CES, NPS, and CSAT helps you pinpoint areas for improvement and build stronger customer relationships.
FAQ
What is the best metric for improving customer experience?
The best metric depends on your goals. Use CES to reduce friction in interactions, NPS to measure loyalty, and CSAT to evaluate satisfaction at specific touchpoints. Combining these metrics provides a holistic view of your customer experience, helping you identify and address key areas for improvement.
How often should you measure CES, NPS, and CSAT?
You should measure CES and CSAT immediately after key interactions, such as support calls or purchases. NPS works best when measured quarterly or annually to track long-term loyalty trends. Sobot’s tools can automate survey timing, ensuring consistent and accurate data collection.
Can you use CES, NPS, and CSAT together?
Yes, combining these metrics offers a comprehensive understanding of customer experience. For example, CES identifies friction points, CSAT evaluates satisfaction at specific moments, and NPS tracks overall loyalty. Sobot’s Voice/Call Center integrates these metrics seamlessly, enabling you to monitor and improve every aspect of the customer journey.
How does Sobot simplify the use of these metrics?
Sobot’s Voice/Call Center automates survey distribution and data analysis. Features like real-time monitoring and AI-powered tools help you collect CES, NPS, and CSAT data effortlessly. This integration allows you to act on insights quickly, improving satisfaction, loyalty, and overall customer experience.
Why is customer effort important in customer experience?
High customer effort often leads to dissatisfaction and churn. Research shows that 94% of customers repurchase after a low-effort experience. By reducing effort through tools like Sobot’s smart call routing, you can enhance satisfaction and foster loyalty, driving long-term business success.
See Also
Comparing Leading Customer Feedback Software Solutions
Enhancing Efficiency with AI-Driven Customer Support Tools
The 2024 List of Premier Customer Support Software