Mastering Customer Service KPIs in 2025

Customer service KPIs play a pivotal role in driving business success in 2025. With 93% of teams acknowledging rising customer expectations, tracking these metrics ensures you stay ahead. Businesses excelling in customer experience see 1.5 times more engaged employees, boosting efficiency. Tools like Sobot empower you to meet these demands and deliver exceptional service.
Understanding Customer Service KPIs

What Are Customer Service KPIs and Why Do They Matter?
Customer service KPIs are measurable values that help you evaluate the performance of your support team. These metrics provide insights into how well your team meets customer expectations. By tracking KPIs, you can identify areas for improvement and ensure your service aligns with business goals.
For example, First Contact Resolution Rate measures the percentage of issues resolved in the first interaction. A high rate, typically over 80%, indicates efficiency and customer satisfaction. Another key metric, Average Handle Time (AHT), tracks how long it takes to resolve a query. Keeping this between 60-120 seconds ensures quick and effective service. These KPIs matter because they highlight strengths, weaknesses, and trends, helping you make informed decisions.
Common Standards for Measuring Customer Satisfaction
Measuring satisfaction involves using specific metrics to gauge how happy customers are with your service. The Customer Satisfaction Score (CSAT) is a widely used standard. It asks customers to rate their experience on a scale of 1 to 5. You calculate CSAT by dividing the number of positive responses (4 or 5) by the total responses and multiplying by 100. An average score of 62.5% is common, but top-performing industries aim for 85% or higher.
Other standards include the Net Promoter Score, which measures customer loyalty, and the Customer Effort Score, which assesses how easy it is for customers to interact with your business. These metrics help you understand customer needs and improve their experience.
The Role of KPIs in Enhancing Customer Experience
KPIs play a crucial role in improving the customer experience. They allow you to monitor performance, set goals, and benchmark against competitors. For instance, a major retail chain improved its CSAT by 15% in six months by analyzing survey data and training staff. This also boosted their Net Promoter Score from 25 to 45, showing how KPIs drive better outcomes.
Tracking KPIs like resolution time and repeated contact rate helps you identify pain points and streamline processes. By focusing on these metrics, you can create a seamless and satisfying experience for your customers.
Identifying and Prioritizing the Right KPIs
Using SMART Criteria to Define Effective KPIs
Defining effective customer service KPIs requires a structured approach. The SMART criteria—Specific, Measurable, Achievable, Relevant, and Time-bound—ensures your goals are clear and actionable. For example:
- Reduce customer wait times by 10 seconds within three months.
- Improve the customer satisfaction score by 5% by year-end.
- Enhance the net promoter score by addressing customer feedback quarterly.
These examples highlight how SMART goals provide clarity and focus. They help you track progress and measure success effectively. By applying this method, you can align your key performance indicators with your business objectives and customer expectations.
Essential Customer Service KPIs to Track in 2025
Tracking customer experience KPIs is vital for understanding performance and improving satisfaction. Focus on these essential metrics in 2025:
| KPI | Description | Calculation Method |
|---|---|---|
| Customer Churn Rate | Percentage of customers who stop using the product or service. | Total churned customers / Total customers |
| Average Resolution Time | Time taken to resolve customer issues. | Total resolution time / Total resolved cases |
| Net Promoter Score | Measures customer loyalty and likelihood to recommend. | Based on survey responses on a scale of -100 to 100. |
| Customer Satisfaction Score | Direct measure of customer happiness with interactions. | (Number of Satisfied Customers / Total Survey Responses) × 100 |
These metrics provide actionable insights. For instance, monitoring average resolution time helps you identify bottlenecks and improve efficiency. Similarly, tracking the customer retention rate reveals trends in loyalty, enabling you to address potential issues proactively.
Tailoring KPIs to Your Business Goals and Industry
Every industry has unique needs, so tailoring KPIs to your business goals ensures relevance. For example:
| Industry/Vertical | Key Performance Indicators (KPIs) | Relevance to Business Goals |
|---|---|---|
| Retail | Foot traffic | Measures customer engagement and sales potential |
| Hospitality | Occupancy rates | Indicates operational efficiency and revenue generation |
| Manufacturing | Utilization rates | Assesses production efficiency and resource management |
In retail, tracking foot traffic helps you gauge customer engagement. In manufacturing, utilization rates highlight production efficiency. Aligning KPIs with your industry ensures you focus on what matters most, driving better results and customer satisfaction.
Tip: Regularly review your KPIs to ensure they remain aligned with evolving business goals and customer expectations.
Tracking Customer Experience KPIs with Sobot
Leveraging Sobot's Voice/Call Center for KPI Tracking

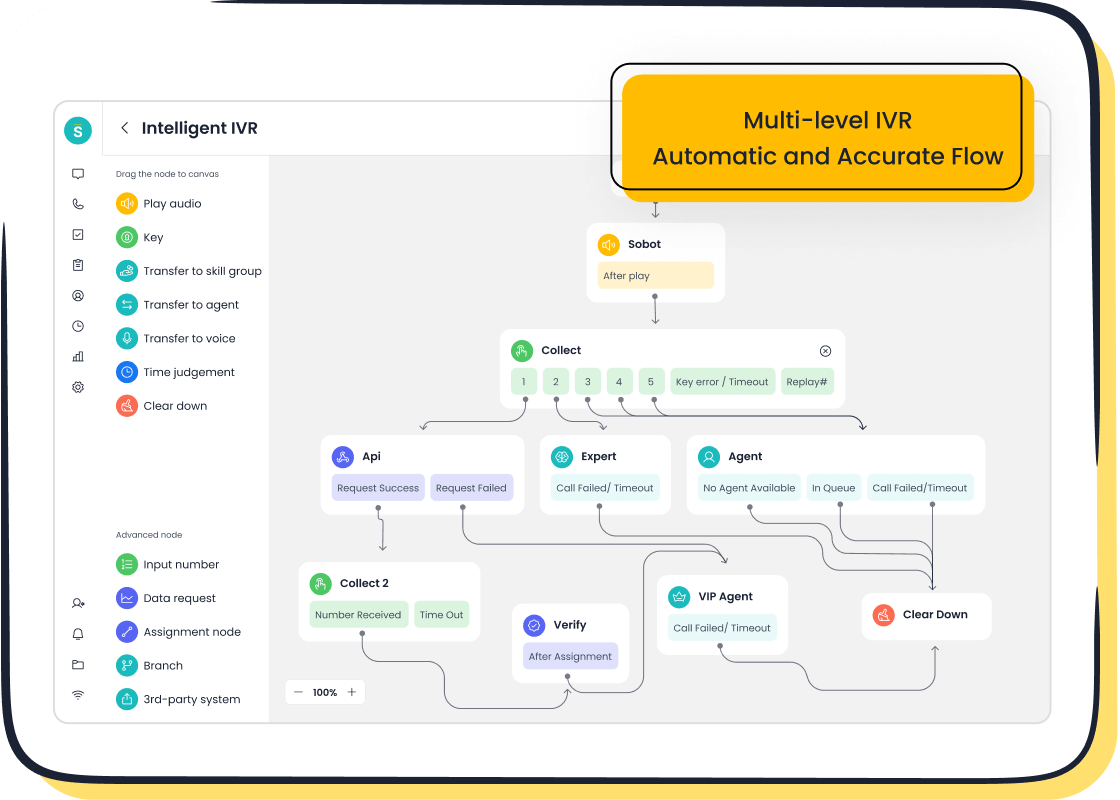
Sobot's Voice/Call Center offers a powerful platform for tracking customer service metrics and improving outcomes. By using features like real-time monitoring, intelligent IVR, and AI-powered voicebots, you can measure essential KPIs such as average resolution time, customer satisfaction, and net promoter score. These tools help you identify bottlenecks and streamline your processes.
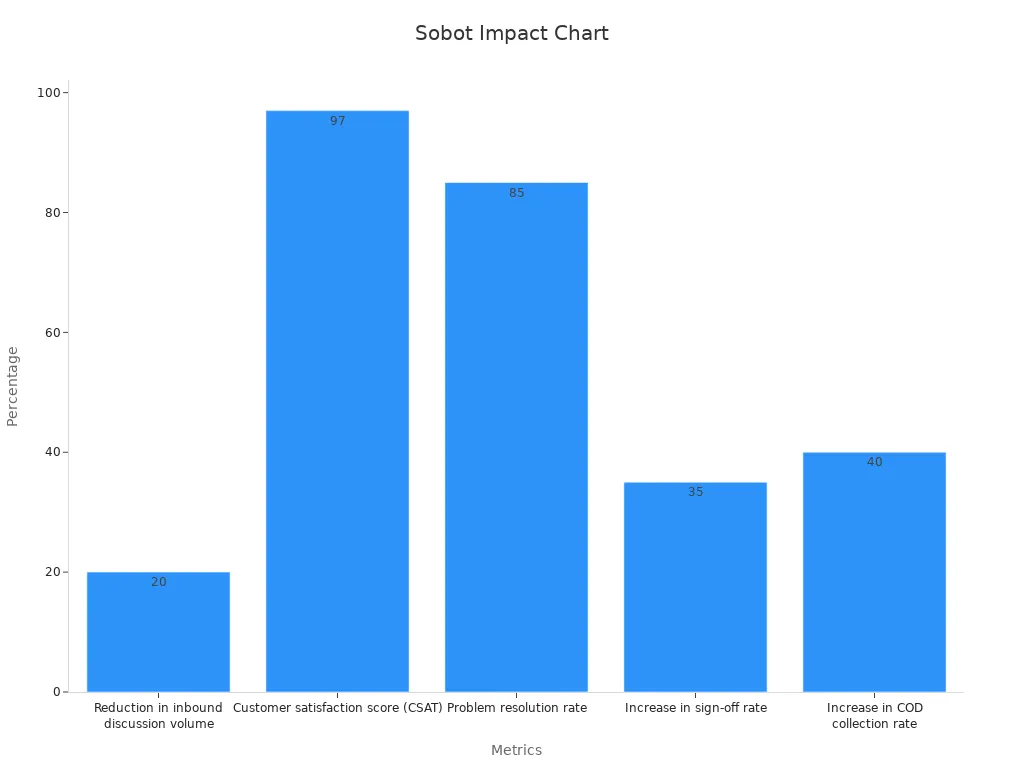
For example, companies using Sobot have achieved remarkable results. A 20% reduction in inbound discussion volume and a 97% customer satisfaction score highlight the platform's effectiveness. Additionally, the problem resolution rate reached 85%, while the positive feedback rate exceeded 96%. These metrics demonstrate how Sobot enhances customer experience and operational efficiency.
| Metric | Result |
|---|---|
| Reduction in inbound discussion volume | 20% |
| Customer satisfaction score (CSAT) | 97% |
| Problem resolution rate | 85% |
| Positive feedback rate | 96%+ |
| Increase in sign-off rate | 35% |
| Increase in COD collection rate | 40% |
Tools and Techniques for Real-Time Monitoring
Real-time monitoring is essential for tracking KPIs and ensuring high performance. Sobot's Voice/Call Center provides advanced tools like speech analytics and AI-powered chatbots. These tools analyze customer interactions, detect churn signals, and provide actionable insights. For instance, speech analytics can identify areas for improvement, while chatbots automate repetitive tasks, improving efficiency.
Key metrics like first contact resolution and customer satisfaction score benefit from these tools. Optimizing CSAT by just one point can increase revenues by 2.5%. Similarly, improving first contact resolution reduces operational costs and enhances customer satisfaction. Sobot's platform ensures you stay ahead by adapting to customer needs in real time.
Ensuring Data Accuracy and Consistency in KPI Analysis
Accurate data is the foundation of effective KPI analysis. Sobot ensures data quality through rigorous validation and transformation processes. This guarantees that your metrics reflect real-world events and provide actionable insights. Dimensions like data accuracy, completeness, and timeliness are critical for maintaining consistency.
| Dimension | Description |
|---|---|
| Data Accuracy | The degree to which data correctly represents real-world events or objects. |
| Data Completeness | Whether the data covers the full scope of the question and identifies any gaps or biases. |
| Data Uniqueness | Ensures there are no duplicate records in the database. |
| Data Timeliness | The degree to which data is up-to-date and available when needed. |
| Data Validity | How well data meets certain criteria based on prior analysis. |
| Data Integrity | The accuracy and consistency of data throughout its lifecycle. |
Sobot's platform also includes integrity checks and consistency verification, ensuring your KPI tracking remains reliable. By maintaining high data standards, you can make informed decisions and continuously improve your customer service metrics.
Analyzing and Acting on KPI Insights
Identifying Trends and Patterns in Customer Data
Understanding trends in customer data helps you uncover valuable insights. By analyzing historical patterns, you can predict future behaviors and optimize your strategies. Techniques like cohort analysis and time-series analysis are particularly effective. For example, cohort analysis compares the behavior of different customer groups over time, helping you improve lifetime value. Time-series analysis tracks historical data to identify trends and seasonality, which can guide campaign planning and budgeting.
To make sense of your data, use tools like business intelligence platforms or CRM software. These tools help you visualize trends and detect anomalies. For instance, a sudden drop in the customer retention rate might indicate a service issue that needs immediate attention. Regularly tracking metrics like the net promoter score and average resolution time ensures you stay ahead of potential problems.
Tip: Early identification of trends allows you to adapt quickly, capitalize on opportunities, and mitigate risks.
Turning Insights into Actionable Strategies
Once you identify patterns, the next step is to act on them. Start by prioritizing areas with the most significant impact on customer satisfaction. For example, if data shows a high cart abandonment rate in e-commerce, focus on streamlining the checkout process. Similarly, if your resolution times are longer than industry standards, invest in training or technology to improve efficiency.
Use advanced analytics methods like predictive and prescriptive analytics to guide your decisions. Predictive analytics forecasts future outcomes, while prescriptive analytics suggests the best course of action. For instance, reducing average resolution time by 20% could lead to a 15% increase in customer satisfaction. Tools like Sprinkle Data and Tableau can help you transform insights into measurable results.
Measuring the Impact of Changes on Customer Satisfaction Score
Measuring the effectiveness of your strategies is crucial. Use structured surveys and satisfaction metrics to track progress. For example, compare customer satisfaction scores before and after implementing changes. A rise in the net promoter score or a drop in resolution times indicates success.
Quantitative methods like ROI analysis and customer retention rates also provide valuable insights. For instance, tracking sales figures before and after a new initiative can reveal its impact on customer loyalty. Regularly reviewing these metrics ensures your strategies remain effective and aligned with your goals.
| Method | Purpose |
|---|---|
| Customer Retention Rates | Tracks the percentage of customers retained after operational changes. |
| Structured Surveys | Gathers quantifiable data on customer satisfaction levels. |
| Customer Satisfaction Metrics | Measures satisfaction quantitatively over time. |
Note: Continuous evaluation helps you refine your strategies and maintain high performance.
Assigning Roles and Responsibilities for KPI Management
Defining Ownership of KPI Tracking and Analysis
Assigning clear ownership for KPI tracking ensures accountability and consistent performance updates. When you designate specific individuals or teams to manage key metrics, you create a structured approach to monitoring and improving customer service. For example, Tech Innovate realigned its focus on customer satisfaction and innovation, leading to a 25% increase in customer retention and over $1 million in additional revenue. Similarly, a manufacturing plant in Ohio improved productivity by 25% and saved $1.2 million annually by implementing defined KPI ownership.
To streamline this process, establish a tracking frequency and assign roles based on expertise. For instance, a team leader might oversee the Customer Satisfaction Score, while a data analyst manages the Net Promoter Score. This division of responsibilities ensures that each metric receives the attention it deserves.
| KPI | Description |
|---|---|
| Customer Satisfaction Score | Measures the quality of customer service interactions, crucial for evaluating service reps. |
| Net Promoter Score | Assesses customer loyalty and willingness to recommend the service, indicating overall satisfaction. |
| Customer Retention Rate | Tracks the percentage of customers retained over time, reflecting the effectiveness of service. |
| AI Utilization Rate | Indicates the adoption of AI tools in customer service, which can enhance efficiency and performance. |
| Customer Effort Score | Measures the ease of customer interactions, aiming to reduce friction in service experiences. |
Training Teams to Use Sobot's Tools Effectively
Proper training ensures your team maximizes the potential of Sobot's tools. Equip your staff with the skills to use features like real-time monitoring and intelligent IVR. For instance, training agents to analyze average resolution time can help identify bottlenecks and improve efficiency. Regular workshops and hands-on sessions can familiarize your team with Sobot's AI-powered voicebots and unified workspace.
Encourage continuous learning by providing access to resources like tutorials and FAQs. This approach not only boosts individual performance but also enhances overall team productivity. A well-trained team can leverage Sobot's tools to deliver exceptional customer service and achieve better outcomes.
Encouraging Cross-Department Collaboration for Better Results
Collaboration across departments strengthens your ability to meet customer expectations. When teams share knowledge and align their goals, they can improve key metrics like customer satisfaction and retention. For example, fostering communication between marketing and customer service teams can help address customer pain points more effectively.
| Metric Type | Description |
|---|---|
| Team Performance | Assesses how well teams meet deadlines and project objectives. |
| Key Performance Indicators (KPIs) | Includes project completion rate, customer satisfaction, and revenue from collaborative projects. |
| Communication Metrics | Tracks messages exchanged, meeting frequency, and response times. |
| Knowledge Sharing | Measures shared documents and contributions to knowledge bases. |
| Employee Engagement | Indicates collaboration levels through engagement and retention rates. |
To encourage collaboration, establish clear communication channels and schedule regular check-ins. Cross-training sessions can also help teams understand each other's roles, fostering a sense of unity. By working together, your organization can achieve higher efficiency and improve customer satisfaction.
Mastering customer service KPIs in 2025 ensures you identify strengths and weaknesses, leading to better satisfaction and loyalty. Retaining customers costs less than acquiring new ones, boosting profitability.
Tip: Start with core metrics, ensure data quality, and adjust targets regularly. Use Sobot's Voice/Call Center to optimize operations and elevate satisfaction.
FAQ
What are the benefits of using Sobot's Voice/Call Center for KPI tracking?
Sobot's Voice/Call Center offers real-time monitoring, AI-powered tools, and seamless integration. These features help you track KPIs accurately and improve customer satisfaction.
How does Sobot ensure data accuracy in KPI analysis?
Sobot uses rigorous validation processes, integrity checks, and real-time updates. These measures ensure your data remains accurate, complete, and reliable for effective decision-making.
Can Sobot's tools adapt to different industries?
Yes, Sobot's solutions are versatile. They cater to industries like retail, finance, and manufacturing, aligning with specific business goals and customer service needs.
See Also
Essential Strategies for Effective Call Center Quality Management
2024's Leading Customer Service Software Solutions Reviewed
Comprehensive Review of Leading Contact Center Solutions 2024